







Central Texas Housing Market Slows in September 2026 as Mortgage Rates Rise, but Home Prices Tell a Different Story
For Central Texas homeowners wondering what their property might be worth, families hoping to purchase their first home and renters watching monthly housing costs, the latest real estate numbers offer a mixed picture. Homes are taking longer to find buyers in some communities, mortgage rates continue to complicate affordability, and prices are moving in different directions depending on where someone lives.
According to the September 2026 Central Texas Housing Report, released October 13 by Unlock MLS, residential home sales across the Austin-Round Rock-San Marcos metropolitan area declined 14.8% compared to September 2025, with 2,223 homes sold. Yet the region's median home sales price increased 1.4% to $421,000.
That combination tells an important story. Fewer homes are changing hands, but that does not necessarily mean homes are becoming less expensive. For buyers in Austin, Round Rock, Georgetown, Kyle, Buda and surrounding communities, the price of a home is only part of the affordability equation. Mortgage interest rates, property taxes, insurance and other ownership costs all influence what a family can comfortably afford each month.
The report also reveals meaningful differences across Travis, Williamson, Hays, Bastrop and Caldwell counties, where some communities experienced rising home prices while others saw declines.
Central Texas Home Sales Fall as Mortgage Rates Challenge Buyers
September's slowdown came as higher mortgage rates increased monthly payments for prospective homebuyers, particularly those entering the housing market for the first time.
Across the five-county Austin-Round Rock-San Marcos metropolitan statistical area, pending sales declined just 1.8% year over year to 2,313 transactions. That relatively small decrease, compared with the sharper drop in completed sales, suggests buyers were still entering contracts despite the challenges.
Vaike O'Grady, research advisor at Unlock MLS, said the latest figures illustrate how quickly borrowing costs can influence housing activity.
“September's decline in closed sales is significant, and it shows just how sensitive today's housing market is to changes in mortgage rates. We had been seeing steady activity, but the recent increase in rates created another hurdle for buyers, especially those trying to enter the market for the first time. The biggest factor for many buyers isn't necessarily the price of the home, but what that price means for their monthly payment at today's rates. While affordability remains a real challenge, we're still seeing activity in the market. The question now is how buyers and sellers respond to these conditions in the months ahead.”
For a family considering a $400,000 home, even a relatively small change in mortgage rates can affect the monthly payment and the amount a lender is willing to finance. That makes interest rates especially important for households trying to balance housing costs with everyday expenses.
At the same time, sellers appear to be finding somewhat closer agreement with buyers on pricing.
Homes sold across the metropolitan area closed at an average of 92.7% of their original asking price, compared with 91.4% in September 2025. While individual transactions vary, the improvement suggests that completed sales are moving closer to sellers' initial pricing expectations.
September 2026 Central Texas Housing Market at a Glance
|
Housing Market Indicator
|
September 2026
|
Change From September 2025
|
|---|---|---|
|
Median home sales price
|
$421,000
|
+1.4%
|
|
Closed home sales
|
2,223
|
-14.8%
|
|
Active home listings
|
13,465
|
-3.4%
|
|
Housing inventory
|
5.4 months
|
-0.1 month
|
Source: Unlock MLS, September 2026 Central Texas Housing Report. Figures represent the Austin-Round Rock-San Marcos metropolitan area. All comparisons are year over year.
The region recorded 3,546 new home listings, an increase of 2.8% from the previous September. However, the total number of active listings declined 3.4% to 13,465.
The total dollar volume of residential sales fell 10.4% to approximately $1.27 billion.
Together, those figures suggest a market where buyers continue to have options, but available inventory, pricing and competition vary considerably by location.
Austin Home Prices Rise Even as Sales Decline
Within the City of Austin, September's median home sales price reached $570,958, an increase of 4.2% from the previous year.
Despite that price growth, only 777 residential properties sold during the month, a 12.7% decline from September 2025.
Austin also recorded 4,502 active home listings, down 10.3%, while pending sales decreased 8.6% to 743. New listings totaled 1,295, a 1.1% decline.
The city had 5.4 months of housing inventory, slightly below the previous year's level, and approximately $604.8 million in residential sales volume, down 5.2%.
Homes sold at an average of 92.5% of their original asking price, compared with 90.8% a year earlier.
For Austin homeowners, the numbers show that slower sales activity does not automatically translate into declining property values. However, the citywide median does not establish what an individual home is worth. Neighborhood characteristics, property condition, recent comparable sales and price range remain important considerations.

Williamson County Home Prices Dip as More Listings Enter the Market
In Williamson County, which includes Georgetown, Round Rock, Cedar Park, Leander and other growing communities, the median residential sales price declined 2.5% to $395,000.
The county recorded 765 home sales, down 12.1% from September 2025.
Unlike Austin, Williamson County experienced an increase in newly listed homes, with 1,078 properties entering the market, up 7.7% year over year.
Active listings nevertheless declined 2.8% to 4,249, while pending sales fell 3.4% to 784. Housing inventory stood at five months, a slight decrease from the previous year.
Total residential sales volume reached approximately $346.4 million, down 15%.
Homes closed at an average of 93% of their original listing price, compared with 91.9% a year earlier.
For families looking to buy in Williamson County, the combination of a lower median sales price and more new listings may create opportunities to compare properties. Still, affordability depends on the individual home's price, financing terms and ongoing ownership costs.
Hays County Sees One of the Region's Sharpest Sales Declines
Hays County, home to communities including San Marcos, Kyle, Buda and Dripping Springs, experienced a particularly notable change in September.
Residential sales declined 30.5% year over year, with 294 homes sold.
At the same time, the median home sales price increased 10.8% to $399,900, the largest percentage increase among the five counties covered in the report.
New listings rose 12.4% to 498, while active listings increased 4.9% to 1,898.
The county's housing inventory climbed to 4.8 months, an increase of 0.4 months, and pending sales declined 1.8% to 323.
Residential sales volume fell 17.5% to approximately $160.1 million. Homes sold for an average of 93.2% of their original listing prices, compared with 92.2% a year earlier.
The contrast between falling sales and rising median prices is an important reminder that a countywide median reflects the homes that actually sold during the month. Changes in the mix of properties sold can influence the median, so the increase does not necessarily mean every Hays County home gained value.
Bastrop and Caldwell Counties Show Different Market Conditions
The September report also highlights changing conditions farther east and south of Austin.
In Bastrop County, 105 residential homes sold, a 21.1% decline from September 2025. The median sales price decreased 1.2% to $340,000.
The county recorded 196 new listings, down 6.2%, and 723 active listings, down 10.4%.
Pending sales increased 3.6% to 116, suggesting that contract activity held up better than completed transactions.
Bastrop County had 7.6 months of housing inventory, up 0.9 months from the previous year. Total sales volume declined 23.1% to approximately $40.9 million, while the average close-to-original-list-price ratio increased from 91.1% to 92.2%.
In Caldwell County, which includes Lockhart and Luling, residential sales declined 36.4% to just 28 transactions.
The median sales price increased 1% to $301,500, while active listings rose 33.5% to 235 properties.
New listings declined 7.2% to 64, but pending sales increased 80.8% to 47.
Caldwell County's housing inventory reached 6.4 months, an increase of 1.8 months. Total sales volume fell 40% to approximately $8.5 million, and homes closed at an average of 92.1% of their original listing prices, compared with 90.9% a year earlier.
Because Caldwell County recorded relatively few completed sales, individual transactions and changes in the types of homes sold can have a larger effect on monthly statistics.
How Home Prices Compare Across Central Texas Counties
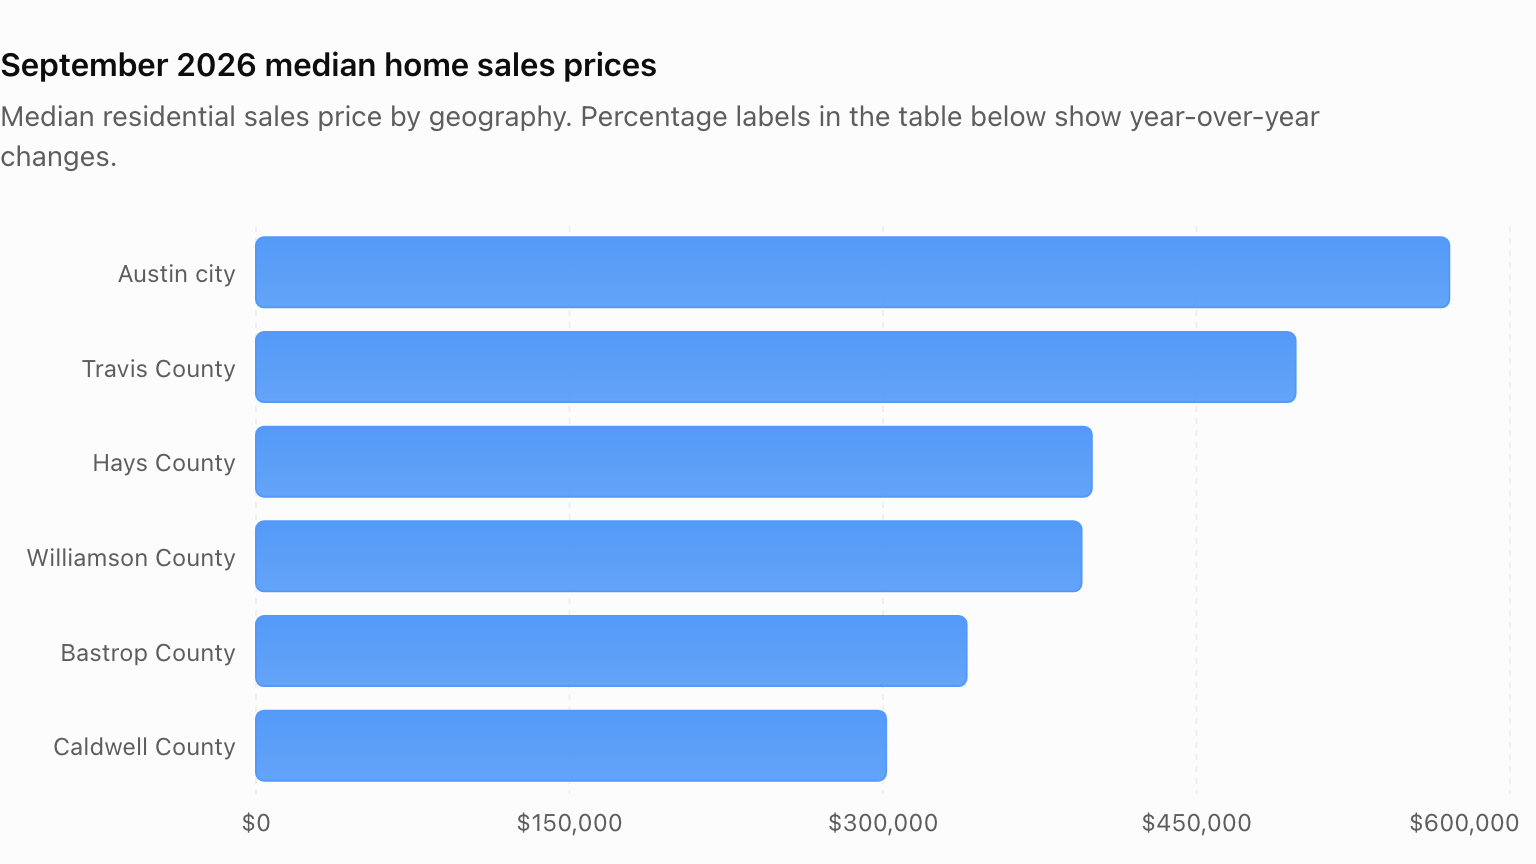
|
Area
|
Median price
|
Annual change
|
|---|---|---|
|
City of Austin
|
$570,958
|
+4.2%
|
|
Travis County
|
$497,400
|
+2.6%
|
|
Williamson County
|
$395,000
|
-2.5%
|
|
Hays County
|
$399,900
|
+10.8%
|
|
Bastrop County
|
$340,000
|
-1.2%
|
|
Caldwell County
|
$301,500
|
+1.0%
|
Source: Unlock MLS. The City of Austin is included within Travis County and the metropolitan area.
Travis County as a whole recorded 1,031 residential sales, down 9.6%, with a median price of $497,400, up 2.6%.
The county also reported 1,710 new listings, down 0.9%, and 6,360 active listings, down 6.1%. Pending sales declined 3.1% to 1,043.
Housing inventory stood at 5.8 months, down 0.2 months, while total sales volume declined 4.6% to approximately $716 million.
Homes closed at an average of 92.5% of their original listing prices, compared with 90.8% in September 2025.
Central Texas Rental Market: Rents Decline in Austin While Bastrop Sees Increases
Homeownership is only one part of Central Texas housing affordability. For residents who rent, the September report reveals a different set of trends.
Across the Austin-Round Rock-San Marcos metropolitan area, the median residential rent declined 2.3% to $2,100, while completed leases fell 10% to 2,242.
The number of active rental listings declined 27.6% to 4,370, and new lease listings fell 16.9% to 2,798.
Rental inventory stood at 1.8 months, down 1.1 months year over year. Pending lease activity declined 2.6% to 2,392, while total lease dollar volume fell 13.2% to approximately $5.19 million.
Properties leased at an average of 95.9% of their original asking rent, compared with 94.5% the previous year.
September 2026 Median Rents by Area
|
Area
|
Median rent
|
Annual change
|
|---|---|---|
|
Austin-Round Rock-San Marcos MSA
|
$2,100
|
-2.3%
|
|
City of Austin
|
$2,195
|
-4.4%
|
|
Travis County
|
$2,175
|
-3.3%
|
|
Williamson County
|
$2,100
|
+0.2%
|
|
Hays County
|
$1,995
|
No change
|
|
Bastrop County
|
$1,997
|
+8.0%
|
|
Caldwell County
|
$1,650
|
+1.5%
|
In the City of Austin, 1,170 leases closed, down 10.1%, while the median rent declined to $2,195. New rental listings dropped 25.4% to 1,382, and active rental listings fell 31.7% to 2,014.
Austin had 1.7 months of rental inventory, down 1.2 months, and 1,227 pending leases, down 1%. Total lease volume declined 16.3% to approximately $2.86 million, while properties leased at 95.4% of their original asking rent, up from 94.1%.
Travis County recorded 1,364 closed leases, down 6.6%, and a median rent of $2,175. The county had 1,589 new rental listings, down 22.3%, and 2,471 active listings, down 28.1%.
Pending leases increased 1.7% to 1,407, while rental inventory declined to 1.8 months. Total lease volume fell 12.6% to approximately $3.3 million, and the average lease-to-original-list-price ratio rose from 94.3% to 95.5%.
Williamson County reported 611 closed leases, a 20.4% decline, while median rent remained relatively steady at $2,100, up 0.2%.
The county had 877 new lease listings, down 9.7%, and 1,336 active listings, down 29.9%. Pending leases declined 11.3% to 713, with rental inventory at 1.8 months. Total lease volume fell 20.3% to approximately $1.33 million, and leases closed at 96.5% of original asking rent, compared with 94.6% last year.
Hays County recorded 185 completed leases, down 3.6%, with median rent unchanged at $1,995. New rental listings declined 2.7% to 252, and active listings fell 19.6% to 440.
Pending leases decreased 5.5% to 188, while rental inventory stood at 2.1 months, down 0.5 months. Lease volume declined 2.6% to $401,491, and properties leased at 96.2% of original asking rent, up from 94.7%.
Bastrop County stood apart from much of the region. Completed leases increased 27.7% to 60, and median rent climbed 8% to $1,997.
Pending leases increased 53.7% to 63, even as new listings declined 3.1% to 62 and active listings fell 18.9% to 90. Rental inventory declined to 1.7 months, down 1.5 months.
Total lease volume increased 39.2% to $121,137, and the average lease-to-original-list-price ratio reached 97.5%, compared with 95.8% a year earlier.
In Caldwell County, 22 leases closed, unchanged from September 2025, while median rent increased 1.5% to $1,650.
New rental listings fell 33.3% to 18, and active listings declined 5.7% to 33. Pending leases dropped 22.2% to 21.
Caldwell County had 2.4 months of rental inventory, an increase of one month. Total lease volume declined 3.9% to $33,764, and the average lease-to-original-list-price ratio slipped slightly from 96.3% to 96%.
For renters considering a move, these differences show why searching for rental homes or apartments in Central Texas requires looking beyond regional averages. Rental prices, availability and competition can change significantly between neighboring communities.
Third-Quarter Housing Data Shows a More Gradual Market Adjustment
While September experienced a sharp decline in closed home sales, the broader third-quarter numbers suggest the regional market's adjustment has been more gradual.
Between July and September 2026, the Austin-Round Rock-San Marcos metropolitan area recorded:
|
Third-quarter 2026 metric
|
Result
|
Change from Q3 2025
|
|---|---|---|
|
Residential homes sold
|
7,748
|
-2.4%
|
|
Median home sales price
|
$420,000
|
-2.3%
|
|
New home listings
|
11,604
|
-0.8%
|
|
Active home listings
|
43,280
|
-1.8%
|
|
Pending sales
|
7,532
|
-1.7%
|
|
Total residential sales volume
|
$4.42 billion
|
-1.7%
|
|
Average close-to-list-price ratio
|
93.2%
|
Up from 92.2%
|
The contrast between September's 14.8% sales decline and the third quarter's 2.4% decline matters because a single month can be affected by short-term changes in financing conditions, transaction timing and buyer behavior.
The quarterly median sales price of $420,000 was 2.3% lower than the same period in 2025, even though September's median price increased year over year.
Those results show why buyers, sellers and homeowners benefit from considering several months of market activity rather than relying on one headline.
What the September Housing Report Means for Buyers, Sellers and Homeowners
For anyone planning to buy or sell a home in Central Texas, the September figures raise a familiar question: Is now a good time to make a move?
The answer depends largely on individual circumstances.
For homebuyers, slower sales activity may provide more time to evaluate properties in certain neighborhoods. However, higher mortgage rates can offset the financial benefit of a lower purchase price. Comparing monthly payments, loan options and total ownership costs remains essential.
For homeowners considering selling, the report reinforces the importance of pricing a property according to recent comparable sales rather than assuming that regional price increases apply equally to every neighborhood. Property condition, location and competition from nearby listings can influence how quickly a home sells.
For renters, lower median rents in Austin and Travis County may offer opportunities to compare lease terms, while rising rents in Bastrop County illustrate how local demand and supply conditions can differ.
John Crowe, 2026 president of Unlock MLS and the Austin Board of REALTORS (ABoR), encouraged residents to consider their own needs rather than making decisions based solely on regional headlines.
“It's easy to look at a headline about declining sales or rising mortgage rates and feel discouraged, but every buyer and seller is in a different position. What's happening across the broader market may look very different depending on the neighborhood, price point or type of home you're considering. That's where working with a knowledgeable real estate agent can make a real difference. They can help you identify opportunities that fit your needs and make informed decisions based on your goals rather than trying to predict what the market will do next.”
For established neighborhoods and growing suburban communities alike, real estate trends affect more than the buying and selling process. Housing affordability can influence where families choose to live, how far residents commute, whether young adults can purchase their first homes and how communities accommodate future growth.
At the same time, changes in median sales prices should not be confused with changes in individual property appraisals or tax bills, which are determined through separate processes.
What's Next for the Central Texas Housing Market?
As Central Texas moves into the final months of 2026, mortgage rates, buyer affordability and available housing inventory will remain important factors to watch.
September's pending sales figures suggest that prospective buyers have not disappeared from the market. However, the decline in completed transactions illustrates how sensitive housing activity remains to financing costs.
The next several monthly reports will help show whether September's sharper slowdown represents a temporary response to changing mortgage conditions or the beginning of a more sustained shift.
For residents, the most useful takeaway may be that there is no single Central Texas housing market experience. A homeowner in Austin, a first-time buyer in Georgetown, a family looking for more space in Kyle and a renter searching in Bastrop may all face different conditions.
Understanding those differences can help families make decisions that fit their budgets, plans and long-term needs.
The September and Q3 2026 Central Texas Housing Report is available through Unlock MLS at UnlockMLS.com/Stats. Unlock MLS has served the Central Texas real estate industry for nearly 60 years and supports approximately 18,000 real estate professionals across its 18-county service region.
Residents can stay connected with My Neighborhood News for additional coverage of Central Texas housing trends, local development, neighborhood growth and the changes affecting communities across the region.

 Tiffany Krenek has been on the My Neighborhood News team since August 2021. She is passionate about curating and sharing content that enriches the lives of our readers in a personal, meaningful way. A loving mother and wife, Tiffany and her family live in the West Houston/Cypress region.
Local business spotlight
Grow your business
where trust already lives.
Let’s introduce your business to the neighbors nearby.
Have a local favorite?
Let’s make an introduction.
Leave your email and our team will reach out with ways to promote your business.
Give a local favorite a little love.
Know a business your neighbors should discover? Tell us who they are.
We couldn’t send that just yet. Please try again.